
details of the meeting can be found in the pdf
WG4 Meeting Deliverable Writing
The meeting of PANGEOS WG4 was held in Varna Bulgaria on the 17 and 18 August 2026. It was a hybrid meeting.
The first day of the meeting started at the conference room of Modus Hotel in the center of Varna.
Meeting TWSI and uncertainty propagation
Actual Participants: Laura Mihai, Mike Werfeli, Andy Hueni, Offer Rozenstein, Dessislava Ganeva, Martin Schlerf, Kadmiel Maseyk, Shawn Kefauver
- Mike Werfeli and Dessislava Ganeva presented the advancement in the TWSI project started after Nitra training course as an example of WG4 and WG3 collaboration, Figure.
 |  |
Figure. Presentation of the uncertainty analysis for TWSI
- Mike presented the work done for Bambësch with the data and information provided by Martin Schlerf.
- Dessislava presented the data acquired during the field campaign in Chirpan in June 2026 potentially for CWSI.
- The participants discussed potential article and its goals
- Alternative datasets were considered. For example, from Shawn from crop and forest. From Offer for orchards or vegetables
Results and conclusions:
- We will continue to work only with Bambësch dataset for forest
- Additionally, to the point thermal data from Apogee, Martin will provide thermal data from drone
- The article will focus on the uncertainty estimation of TWSI from point data to drone data with note and discussion for future thermal satellite with high spatial resolution
Actions:
- Mike and Dessi will prepare a proposal and time frame for the work by the Core meeting in September 2026
Meeting paper on best practices
Actual Participants: Laura Mihai, Mike Werfeli, Andy Hueni, Offer Rozenstein, Dessislava Ganeva, Shawn Kefauver
- Mike presented the idea and the possible datasets for the paper
- Andy presented the impact on even remote cloud on the recorded spectra
- The team worked together on the methodology.
Results and conclusions:
Results, conclusions and actions:
We decided to have the following article structure for the sensitivity tests for:
- Temperature experiment lab
| Dataset | What | Who |
| Temperature experiment on ASD at CETAL Romania (Laser4EU project) | Convert all from DN to Radiance with calibration from CETALPlot in y-axis the correction coefficient c (x) = T(x)/T(Tref=temperature of the calibration) and in x-axis the temperatures from the experiment (15, 20, 25, 30, 35). Find the fitting function in order to have a correction coefficient for each temperatureIn parallel, verify for which temperature there is almost no jump between the detectors. Use this temperature as Tref | Dessi |
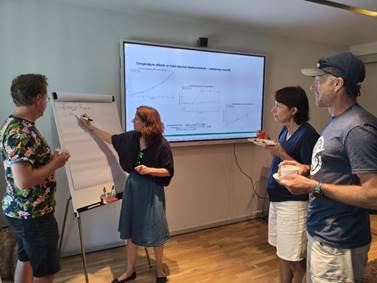
Figure. The work continues during the coffee break
- Temperature influence in the field
| Dataset | What | Who |
| Field Measurement with ASD during 2026 in Chirpan. If necessary, we can add field measurements from 2021, 2022, and 2023 from Chirpan | DN -> L -> R with calibration from CETAL. Case 1, not correctedDN -> L -> c(calculated from T lab experiment) * L =LTcorr -> RTcorrDN -> LJumpCorr -> RJumpCorrCalculate ∆R12 , ∆R23 , ∆R13 and plot | Dessi |
- Influence of the tilt of the reference panel, lab experiment
| Dataset | What | Who |
| Lab measurement with Goniometer at CETAL Romania (Laser4EU project). Remark: the spectral data is <1000nm | To do the same as presented at Prague conference but instead of DN -> L | Dessi |
- Influence of the tilt of the pistol grip, lab experiment
| Dataset | What | Who |
| Lab measurement with Goniometer at CETAL Romania (Laser4EU project). Remark: the spectral data is <1000nm | To do the same as presented at Prague conference but instead of DN -> L | Dessi |
- Pre- and post-panel, field experiment
| Dataset | What | Who |
| Norway dataset | How important is to make Reference-Target-Reference instead of just Reference-Target | Mike |
- Differences between dirty/clean reference panel, field experiment
| Dataset | What | Who |
| Chirpan field campaign 2026 with ASD and big (clean)/small (dirty) panelCost Optimise dataset | Find the difference between the R with clean and dirty reference panel for each datasetCompare the results from the 2 datasets | Dessi Mike Laura |
- Reference panel position
| Dataset | What | Who |
| New experiment | Influence of surrounding on spectral measurement, for example a tree that is close or far from the measurements | Mike |
- Influence from clouds
| Dataset | What | Who |
| Svartberg dataset. Cloud event at 11h30 | Cloud effect on different bandsCompute pseudo PRI | Andy Mike |
Additional Actions:
- Laura to confirm what the temperature is during the calibration of the ASD
- Agree on a timeframe for the completion of the work
Work on 18.08.2026
Meeting article from hackathon
Actual Participants: Laura Mihai, Mike Werfeli, Andy Hueni, Offer Rozenstein, Dessislava Ganeva, Shawn Kefauver, Michal Antala Figure.
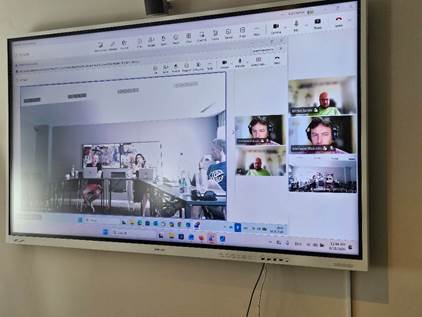
Figure. Hybrid meeting for the hackathon paper
The participants worked through the dataset and the methodology to understand how to include uncertainty into the methodology, Figure. We failed in finishing the discussion before lunch, Figure, so we decided to continue after the discussion about the preparation for the final year of PANGEOS.
Results and conclusions:
We decided to following tasks:
- Base line model – CGM with no uncertainty, no RS, no measured LAI, CHL – WG4 has nothing to do
- CGM + PF + measured LAI + measured CHL
- Michal PF code in R to be transformed into Python
- We work with 1 value that comprises the 2 measurements/plot for 3 plots with the same treatment (irrigation + N)
- Variability = SD(6 measurements) –
, Variability is NOT uncertainty
- For LAI: 2.1. Run Michal PF code (Python) with random uncertainty (5%), where
(in ABSOLUTE)
- For LAI: 2.2. Run Michal PF code (Python) with systematic uncertainty (10%), where
(in ABSOLUTE)
- For LAI, propagate the random uncertainty for
, where LAIx is the LAI measurement from the same condition (irrigation and N)
- For LAI, propagate the systematic uncertainty for
, where LAIx is the LAI measurement from the same treatment (irrigation and N)
- For LAI, propagate the random uncertainty for
;
is a constant
- For LAI, propagate the systematic uncertainty for
;
is a constant
- To do similar uncertainty analysis and propagation for CHL as for LAI
- Remark: for 1 realization of MC, there are 1000 PFs
- CGM + PF + retrieved with ML LAI + retrieved with ML CHL + Reflectance
- Analyse and propagate the uncertainty of the Reflectance to obtain
- To propagate the
through the ML model and application. To do that, we need a meeting with the ML person
- We work with 3 values that comprise the 2 measurements/plot for each plot individually
- For LAI: 3.1. Run Michal PF code (Python) with random uncertainty (5%), where
(in ABSOLUTE), where i is the number of each plot
- For LAI: 3.2. Run Michal PF code (Python) with systematic uncertainty (10%), where
(in ABSOLUTE), where i is the number of each plot
- To do similar uncertainty analysis and propagation for CHL as for LAI
- The result should look like, Figure.
- Analyse and propagate the uncertainty of the Reflectance to obtain


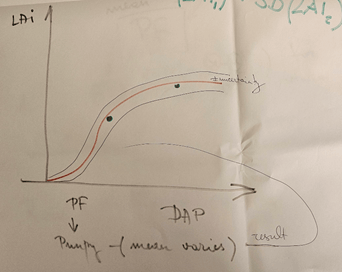
Figure. Result for 1 PF with uncertainty buffer, with the mean of the value (LAI or CHL) that varies
Actions:
| Case | What | Who |
| Cases 2&3 | Michal PF code in R to be transformed into Python | Dessi |
| Cases 2&3 | To get the data from Egor for the CHL measured calibration | Michal |
| Cases 2&3 | To determine the uncertainties for CHL measured | Mike |
| Cases 2 | Uncertainty analysis and propagation for LAI measured through PF | Dessi |
| Cases 2 | Uncertainty analysis and propagation for CHL measured through PF | Mike |
| Cases 3 | Meeting with the ML person | Michal |
| Cases 3 | Obtain  | Mike |
| Cases 3 | Propagate  , ,  , ,  through the ML model and application through the ML model and application | Mike & Dessi |
| Cases 3 | Propagate  , ,  , through the PF , through the PF | Mike & Dessi |
Meeting preparation for the last year of PANGEOS
Actual Participants: Laura Mihai, Mike Werfeli, Andy Hueni, Offer Rozenstein, Dessislava Ganeva, Shawn Kefauver, Esra Tunc, Luke Brown, Jose Gomez-Dans, Lea Hallik, Miriam Machwitz, Kadmiel Maseyk
- Laura went through the MOU to point which parts of it were covered and which still needed work. The participants discussed different possibilities and the results and conclusion are listed below
Results and conclusions:
To strengthen our position with potential stakeholders:
- Shawn proposed to create documents that can serve in our communication with stakeholders: graphical abstracts, common graphical components and multi-language posters
- Dessi proposed to use the webinar series to create short videos that explain PANGEOS scientific concepts to a larger audience.
General:
- To organise the final conference in early summer 2027
How WG4 could complete the proposed in the MOU tasks and deliverables:
- Meeting in Zurich in spring 2027 targeted toward how the PANGEOS members, the community, and stakeholders in general use/apply the uncertainty analysis and propagation in their work. Think about which stakefolder could be involved/invited, for example space agencies – Mike will present a plan during the Core meeting in September 2026
- Student from University of Zurich to work on a code that uses SPECCHIO to automatically propagate uncertainty associated with measurement
- Connection between WG1&WG4 – already covered with multiple activities
- Connection between WG2&WG4
- Miriam, Offer, and Jose will discuss the review article being written as part of WG2 deliverables and get back to WG4 team if additional activities are needed
- The hackathon article in preparation is part of this connection
- Connection between WG3&WG4
- The TWSI article in preparation is part of this connection
- Kadmiel and Shawn proposed an activity for mission validation, for example Flex. Will have proposal by the Core meeting in September 2026
After very long two days and still ahead of us to finish the hackathon article, we asked AI to make us laugh, and the result was quite good.
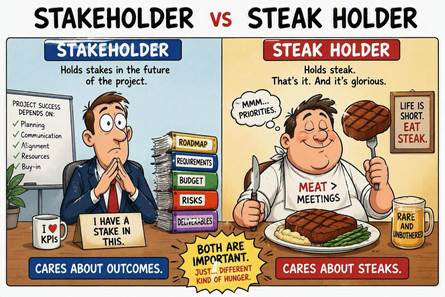
Figure. AI generated image
After the conclusion of the meeting for the preparation for the last year of PANGEOS for the activities of WG4, we returned with Michal to the hackathon article. At the end of the day, everybody was drained but also happy for the work well done.

